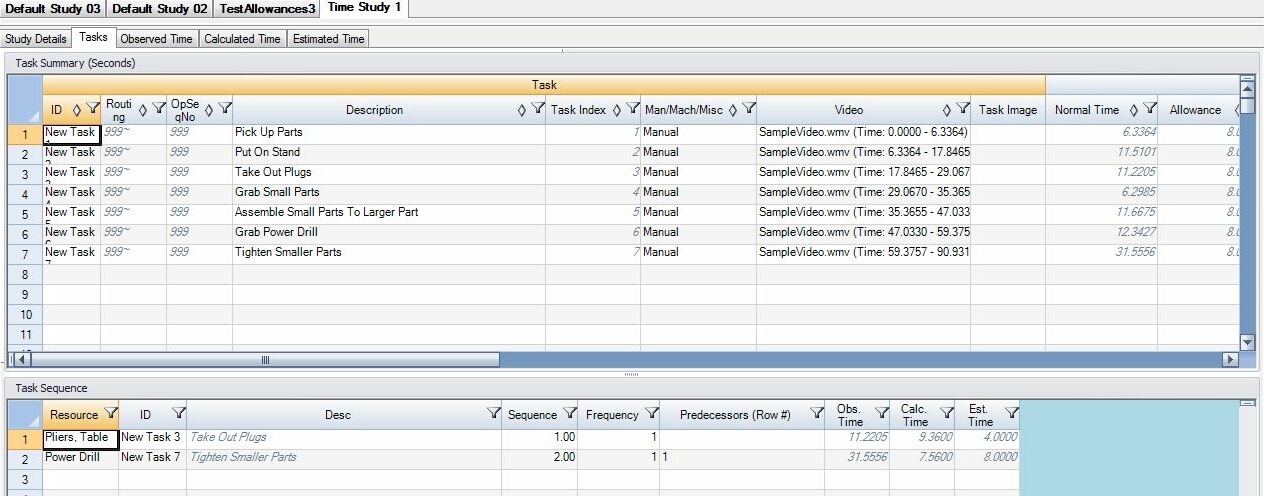
The Tasks tab is meant to contain summary information about your time studies. You can edit the tasks you will be studying and modify the overall process sequence in this tab. Listed below is further details about each of the tables in the Tasks tab.

Tasks Tab in Time Estimation Module of Assembly Planner
Task Summary Table
One purpose of the Task Summary table is to allow you to add and edit tasks for the study. The task lists in this tab, as well as the three time study tabs are linked. Therefore, any task changes made in any of the tables will be reflected in the other task tables.
The Task Summary table also displays summary information about the studies performed for each task.
•ID: The ID of the task. If no task ID is manually entered, a default value will be assigned.
•Routing: The routing that is associated with the time study. This field is auto populated to be 999~.
•OpSeqNo: The sequence in which the tasks are performed. This field is auto populated to be 999.
•Description: This leaves room to add more detail about which element is being studied in this row.
•Task Index: A non-editable field that displays the order in which the tasks were organized at the time of the last save.
•Man/Mach/Misc: You can choose to define a type for each task: manual, machine, or miscellaneous. The default setting is 'Manual'. Both Manual and Machine correspond to labor times; Miscellaneous is an optional category and you can choose not to use it.
•Video: A default video can be set for a each task. Any video from which an observation has been recorded for a particular task can be selected from the drop-down menu in this cell.
•Task Image: If an image has been captured for a task, it will be displayed in this cell. The image can be enlarged by double-clicking on the cell.
The following fields are non-editable from the Tasks tab and displayed for the Observed Time study performed:
•Normal Time: Displays the normal time for a task within the study.
•Allowance: Displays the allowance assigned to a task.
•Standard Time: Displays the standard time of the task, which accounts for the allowance set.
•VA: Displays the value-added time defined for a task.
•NVA: Displays the non value-added time defined for a task.
•SVA: Displays the semi value-added time defined for a task.
•Classification Total: This signals how VA/NVA/SVA values have been edited previously. If a value besides zero is displayed in the Classification Total Column, there is data stored in the Time Classification window. If the value is zero in the Classification Total Column, values have only been edited in the spreadsheet directly.
•Count: Displays the number of observations recorded for a task.
•Minimum: Displays the minimum observed time recorded for a task.
•Maximum: Displays the maximum observed time recorded for a task.
•Average: Displays the average of all observed times recorded for a task.
The following fields are non-editable from the Tasks tab and displayed for the Calculated and Estimated Time studies performed:
•Normal Time: Displays the normal time for a task within the study.
•Allowance: Displays the allowance assigned to a task.
•Standard Time: Displays the standard time of the task, which accounts for the allowance set.
•VA: Displays the value-added time defined for a task.
•NVA: Displays the non value-added time defined for a task.
•SVA: Displays the semi value-added time defined for a task.
•Classification Total: This signals how VA/NVA/SVA values have been edited previously. If a value besides zero is displayed in the Classification Total Column, there is data stored in the Time Classification window. If the value is zero in the Classification Total Column, values have only been edited in the spreadsheet directly.
Importing Activities for New Study: If the Observed Time Study box is checked within the Time Estimation tab in the Options section, an "Import Activities" right-click menu option will appear allowing you to add activities to the study that already exist in the Assembly Planner database. A standard search window will appear. One or more activities may be selected and added to the current task summary table using the ADD button.
Task Sequence Table
The Task Sequence table can be used to define the process being studied exactly as it is performed. For example, if you have a task that is performed multiple times in a row, you can set a frequency for that task within a process cycle. You can also define tasks that are predecessors to others. This control also allows you to re-use tasks (if they are performed at various points in the cycle). The task sequence defined in the Task Sequence table is used for sorting and reporting purposes.
You can add tasks to the Task Sequence table by selecting the task ID in the drop down menu in the ID column, or by double-clicking on the row header in the Task Summary table of the task you would like to add.
The following fields are included in the Task Sequence table:
•Resource: This is a user-defined name for the resource performing the task in the given sequence (Operator 1, Operator 2, Machine A, Machine B, etc.). This information is used in correlation with the Man/Mach/Misc to be displayed on the Man Machine Utilization Report.
•ID: The ID of the task, as set in the Task Summary table and selected using the drop down in the Task Sequence table.
•Description: The task description from the Task Summary table corresponding to the selected ID.
•Sequence: The order in which tasks are displayed on the vertical axis of the Gantt Chart and the order tasks are displayed in the Task Sequence table when a save is called.
•Frequency: The number of times a task occurs within a given cycle. The default setting is 1.
•Obs. Time: The observed time for each task is displayed for reference purpose.
•Calc. Time: The calculated time for each task is displayed for reference purpose.
•Est. Time: The estimated time for the task is displayed for reference purpose.
•Predecessors: List the row number(s) of any tasks listed in the Task Sequence table that must be performed before the selected task can begin.
Note: In the Man-Machine Utilization Report, a timeline will be shown for each resource individually, then a timeline will be shown for all resources collectively. Vertically, the order of the tasks is defined by the Sequence values set in the Task Sequence table. Horizontally, the order of the tasks in the timeline is determined by the Predecessors defined in the Task Sequence table.
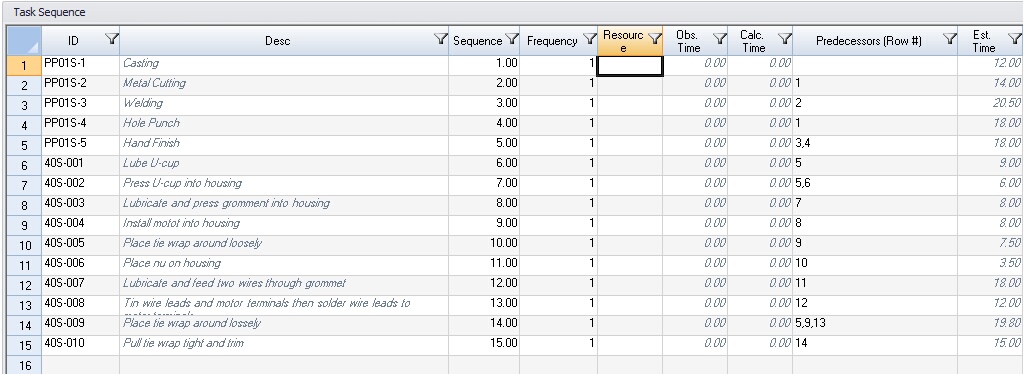
Below is an example of Task Sequencing and the resulting output generated when a Time Study Report is run. To demonstrate the correlation with which the Proplanner tools complement each other, the tasks included in the example are from Proplanner's Mixed Pump ProBalance Tutorial. The Line Balance information from ProBalance can be brought into Assembly Planner. A portion of the precedence network corresponding to the ProBalance Mixed Pump tutorial is included. The tasks included in the Mixed Pump Tutorial precedence network have been used in the Assembly Planner Task Sequencing Example below. No resource has been specified in this example because the process is completely manual. If you were generating a Man-Machine chart, you would want to specify the individual machines and operators responsible for each task listed in the sequence.

ProBalance Mixed Pumps Tutorial Precedence Network
The corresponding Task Sequencing window using the Assembly Planner Time Estimation Module is shown.

Task Sequencing Table in Assembly Planner
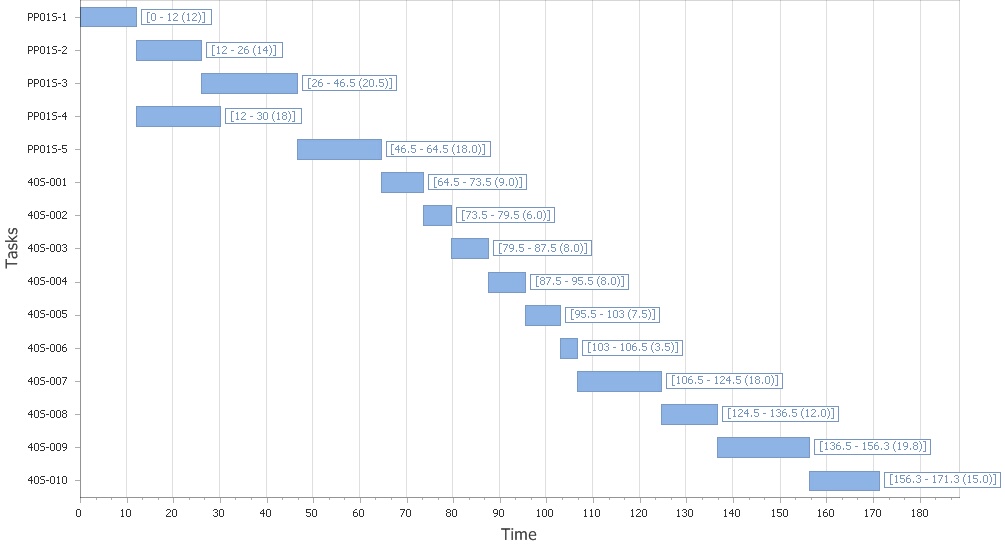
When a Time Study Report is run, the sequence of the tasks is used to display the order of the tasks along the vertical axis of the Gantt chart, and the Predecessors information is used to determine the order that tasks are displayed along the horizontal time axis. The corresponding Gantt Chart generated when a Time Study Report is run is shown below.

Gantt Chart with Task Sequence Populating the Vertical Axis and Predecessors information determining the location of tasks along the Time Axis