Assembly Planner will generate time study summary reports for you after you have completed your time studies. Go to the Reports menu to select the report you would like to generate.
*Note: Some users will see a Posture Allowance category in the pie charts of these reports. In this case, Posture Allowance represents the sum of the time attributed to any allowance you have defined. If the Posture Allowance category is not seen, and allowance has been defined, the sum of the time attributed to any allowance has been added to the sum of time in the 'NVA' category in the chart. What is seen is dependent upon a preference setting that can't be changed from the user interface. If you would like to learn more or have the preference in your system changed, please contact your Proplanner representative.
There are four types of reports available:
1.Time Study Report - To summarize task classification results of Observed, Calculated, or Estimated studies. Pie charts, Pareto charts, and a Gantt chart are used to relay summarized information. You can also choose the Time Standard Rank option, which will generate graphs based on the Time Rank preference. This report will look at the time study data for the highest priority time standard. If times are missing from some tasks, it will then look to the second priority time standard, and so forth. Note: You must define a task sequence before running this report.
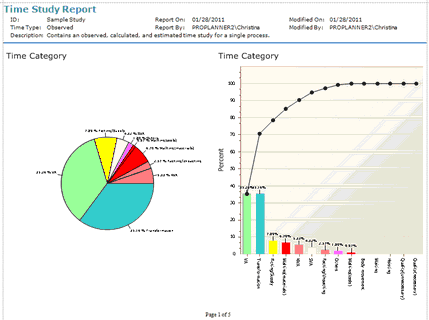
Time Study Report Page 1
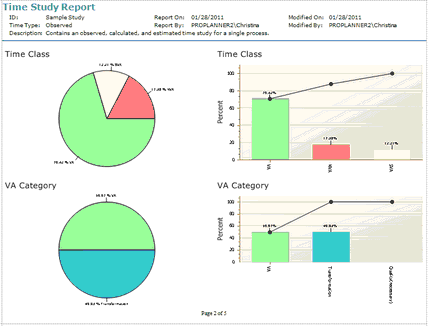
Time Study Report Page 2
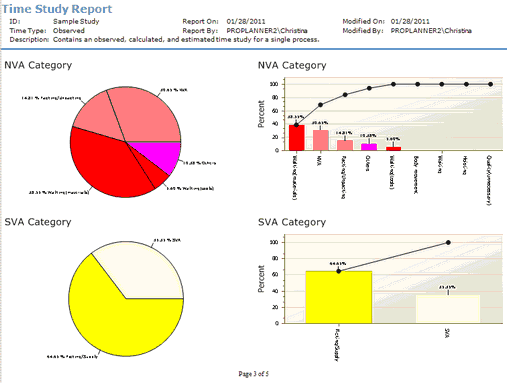
Time Study Report Page 3
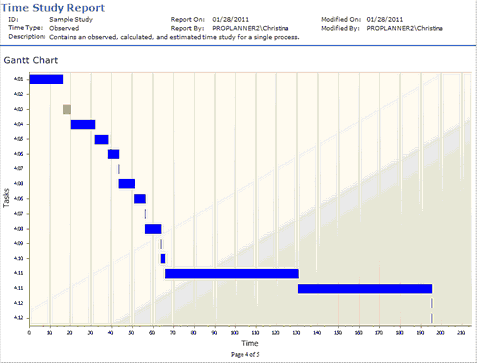
Time Study Report Page 4
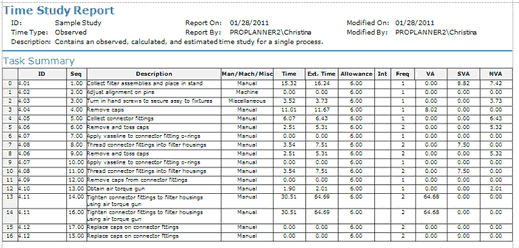
Time Study Report Page 5+ detailed sheet view
2.Observed Time Report - To summarize Observed (stopwatch) time studies.
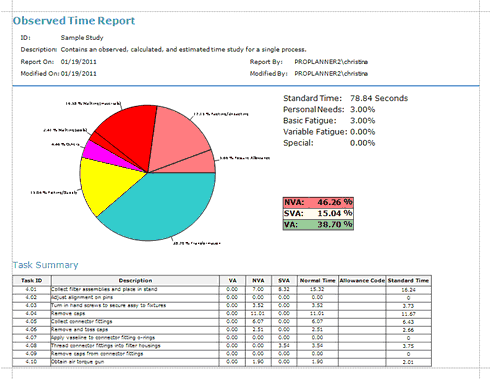
Observed Time Report Page 1
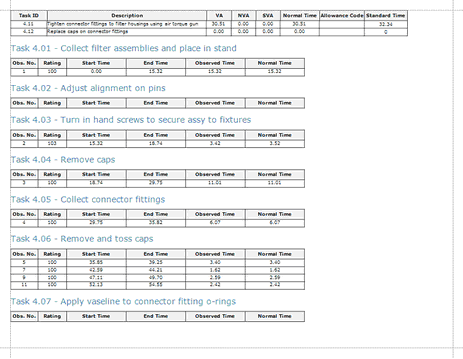
Observed Time Report Page 2+
3.Calculated Time Report - To summarize Calculated (predetermined) time studies.
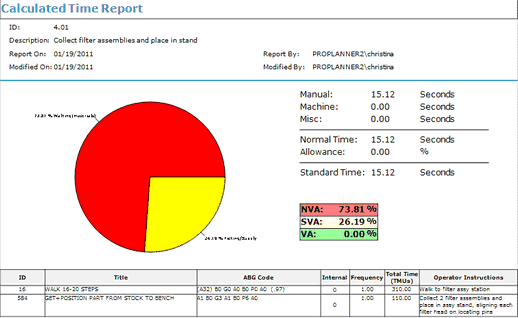
Calculated Time Report
4. Man/Machine Utilization Report - This report shows the utilization and work sequence of multiple resources. The first section displays Gantt charts for each resource individually. Next is a Gantt chart for all resources collectively (shown below). The last page contains a chart showing work time, idle time, and utilization for each resource and for the study as a whole. Please see the Time Estimation Options section and Tasks Tab for details on generating this report.
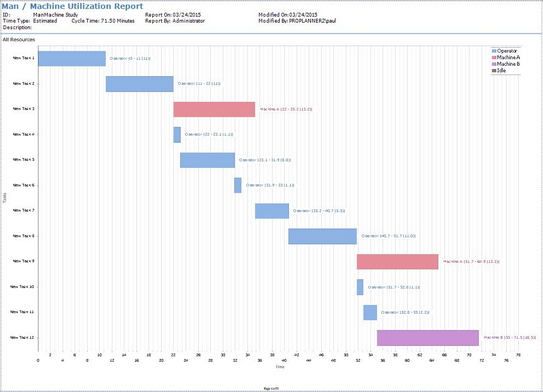
Man Machine Report Gantt Chart
5. View Man/Machine Utilization Chart - This report can be generated to compare Man/Machine charts. This tool creates a chart that can be minimized in order to create new/updated charts. These charts can then be brought up at the same time and compared. The tool is primarily used as a quicker check than the original Man/Machine Report, and is also useful for visual comparison.The charts are automatically updated when the original data is saved, but before saving, clicking on the Refresh button in the top right corner can update the chart with the current data without having to save and overwrite the original data.
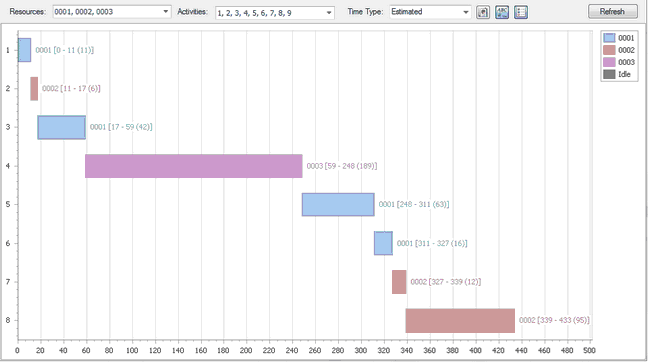
Man/Machine Chart with 3 Resources
This chart also has options for its use; it is the only report that is easily customizable without having to completely re-run the report. The available customization is shown on the next page.
Man/Machine Chart Filters
The Resources dropdown is used to filter resources out of the chart, usually resulting in resource idle time to be shown instead. Check the boxes to be shown and uncheck what is not needed.
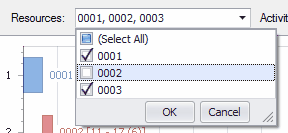
Resource Dropdown Filter
Similarly, the Activities dropdown can be used to filter activities.
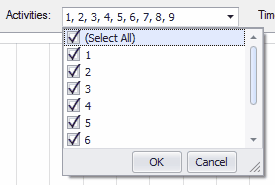
Activites Dropdown Filter
Where the times are being pulled from (Observed, Calculated, Estimated) can also be chosen in the Time Type dropdown.

Time Type Filter
There are also buttons that can show/hide the legend and labels, copy the image to your clipboard, and pin the screen to the top of your Proplanner Application to stop it from being minimized.
Report Controls
Printing and Exporting Reports is accomplished via the File menu at the top left corner of the report. Reports can be saved and exported as PDF, HTML, MHT, RTF, XLS, XLSX, CSV, Text, or Image file.
Page Setup (from the File menu) allows you to change the margins and orientation of the report.
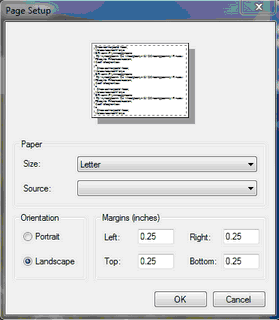
Report Page Setup
The View and Background menus have tools to alter the way the report is viewed, saved, or printed.
The menu bar, as shown below, contains shortcuts to each menu item. If you hover your cursor over each button, a message will display its function.
![]()