To generate the Yamazumi chart for the balance you have open, click on the Yamazumi Chart button in the toolbar.

Yamazumi Chart
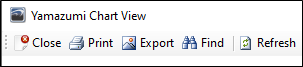
Close: this will close the Yamazumi chart view and return to the line balancing module
Print: contains optional settings for printing the Yamazumi chart
Export: allows user to export the chart as an image in the desired file format (JPEG, TIFF, GIF, PNG, BMP, EMF)
Find: search the Yamazumi chart for tasks based on ID, Description, TaskNo, NetTime, or Task Workzone
Refresh: this we redraw the chart area
![]()
Pan: shifts the view without changing the magnification
Zoom Window: allows user to draw a window in an area of the chart which the view with then zoom in to after the window is drawn
Zoom In: adjusts the chart view to be bigger and closer from the current view
Zoom Out : adjusts the chart view to be smaller and farther from the current view
Zoom Normal: makes a larger zoom in jump to center of current view than zoom in button
Zoom All: adjust the chart to fit the window view
![]()
Show/Hide Legend: depending on what the color coding in the chart is set to, this will show or hide the legend at the bottom of the screen, the default color coding of None will code the tasks by model, and models will be displayed in the legend
Filter Stations: Allows you to pick which stations to display within the Yamazumi Chart.
Viewing Task Details: By double clicking on a specific task tile, or right clicking on it and selecting Properties, will display the task properties window. This window is read only, but it gives a quick reference for the specific task by showing the models, options, resources, and consumption associated to the task. Also if there was a video associated with it at the activity level, then you can view it in the same window.
Chart Type:
•Model – Line View: Displays the work content assigned to each station for each model, the sample below shows the view for a single model at 2 stations

Model- Line View
•Model – Operator View: Displays the work content assigned to each operator for each model, the sample below shows the same 2 stations from above, but broken into each operator's work content, as each station contained 2 operators

Model- Operation View
•Option – Line View: Displays the work content, by station, required for each option.

Option- Line View
•Option – Operator View: Displays the work content, by operator, required for each option.

Option- Operator View
Tile By: this will toggle the tasks to be tiled by either the task itself (1 task = 1 tile) or to be tiled by Group (10 grouped tasks = 1 tile), this can make the chart and tasks easier to view as it should reduce the number of tiles
Color Coding: Gives you the option to color each task in the chart by default or to display VA/NVA/SVA (green/red/yellow) color coding to see the breakdown within the scenario.
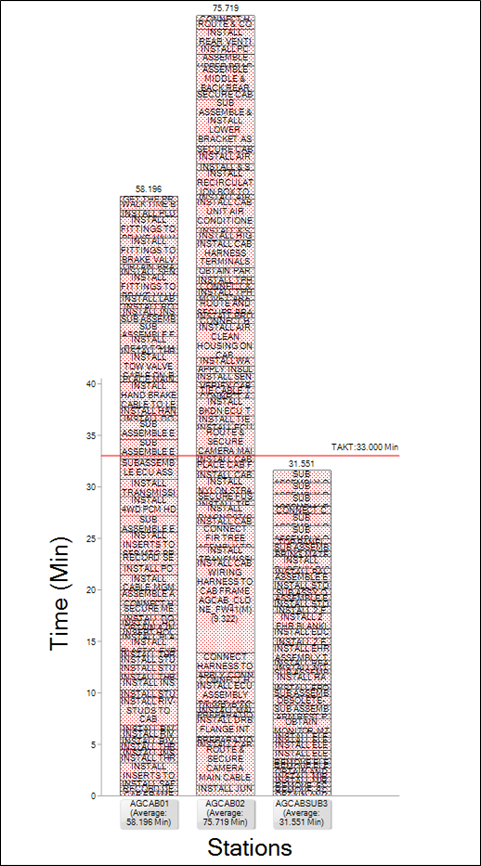
•None: Displays tasks without a coloring scheme

Color Coding Options

Display with No Color Coding
•VA / NVA - Summary: Colors the tasks according to the majority of VA/NVA/SVA classification for each task.

Color Coding Option- VA/NVA - Summary

VA/NVA Color Coding
•VA / NVA - Task Sorted: Colors the tasks according to the VA/NVA/SVA classifications within each task.

Color Coding Option VA/NVA - Task Sorted

VA/NVA Task Sorted Color Coding
•VA / NVA - Time Category: Sorts and colors the VA/NVA/SVA classifications within the station, separating tasks with multiple classifications into multiple tiles before sorting.

Color Coding Option VA/NVA - Time Category

VA/NVA - Time Category Color Coding
•Work Zones: Colors the tasks according to the work zones associated to each task

Color Coding Option Work Zones

Work Zone Color Coding
•Group ID: Colors the tasks according to the Task Grouping as defined in the Line Balance

Color Coding Option Group ID

Group ID Color Coding
Model Filter: Gives you the ability to choose from which models to display tasks and to include the Average or not
Below I’ve selected 2 models to display in the chart, and I am able to make comparison on the operator cycle time for a given model

Model Option List

Model Filter Applied
Option Group Filter: A drop down that allows you to choose from which option group to display tasks, one option group can be selected at a time

Option Group List
Chart Options:

Chart Options
Task Label Options
Task Identifier: Display either Task ID or Task Sequence Number or use a Custom Identifier on the task tiles.
Custom Property: If Custom is selected as the Identifier, the user can select from a wide range of properties to display on each tile, such as Description, SeqNo, Group ID…
Additional Options to display with each tile include, Task Description, Show Task Routing, and Show Task Time
Scaling Options
Scaling Method: Change the size of each task tile and scale of the chart as a whole by Chart Bounds, by Median Task Time, by Minimum Task Time, or by User Input (define height in pixels or reference time using the Reference Node Height and Reference Time Fields)
Reference Node Height: when selecting the User Input selection above, use this field to set the Node Height in Units (or pixels) as an integer value, this determines the height of the tile and scales based on the time value below
Reference Time: enter a time value (depending on scenario preferences), this sets the node height for tasks based on the time of those tasks
Example: If you set the reference node height at 10 pixels and the reference node time to 10 minutes, a 100 minute node should be 100 pixels tall.
Tool Tip Options
Show Models: selecting this option will display the task models when the cursor hovers over a tile in the chart view
Time Method: If net time is selected, it will show all of the work content of the models for that station or operator. The average time will also be displayed with this. If you use weighted time, it only displays the average time for the given station or operator.
Font Size: sets the font size of the text in each tile
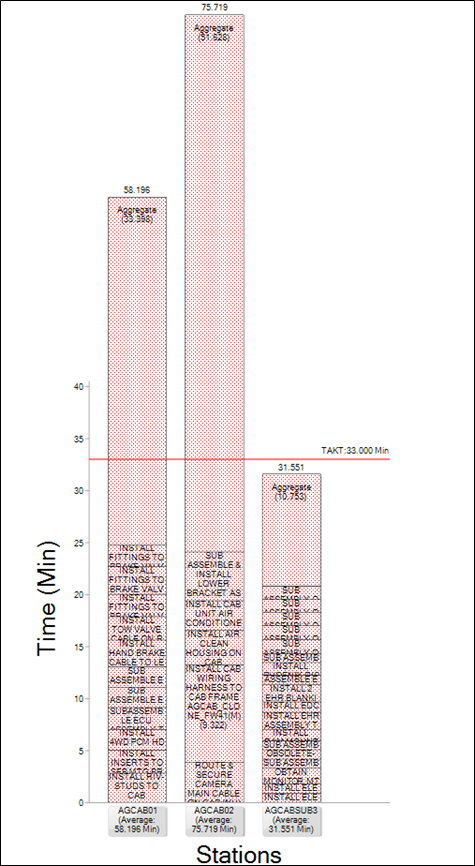
Average Bar Group Tasks Percent: the average bar by default will tile each task included in the average time bar, by providing a value (which represents a percentage) tasks, which represent less time than the value will be grouped in the same tile and tasks that represent more time than the value will be shown as a their own tile, this feature is intended to provide better visibility in the average bar
Using a value of 0 (%) - the Average Bar will include all task tiles as seen in the below left view, while the below right view shows that using a value of 2(%) will group tasks whose time is less than 2% of the total average time