Proplanner's line balancing module is the heart of the Assembly Planner solution and includes the most features, capabilities, and performance of any other Line Balancing application in the market.
Proplanner’s Line Balancing module has the ability to balance and visualize thousands of tasks, hundreds of models and options, hundreds of customer orders, and consider many hard and soft constraints including Precedence, Resources, Workzones, Grouping, Ergonomics, Inspection, and Product Orientation.
Line Balancing involves the assignment of tasks to people at workstations on a sequential assembly line. Tasks need to be assigned in a sequence that does not violate the assembly precedence of the product’s design. In other words, you can’t install the wheel before installing the hub the wheel bolts to.
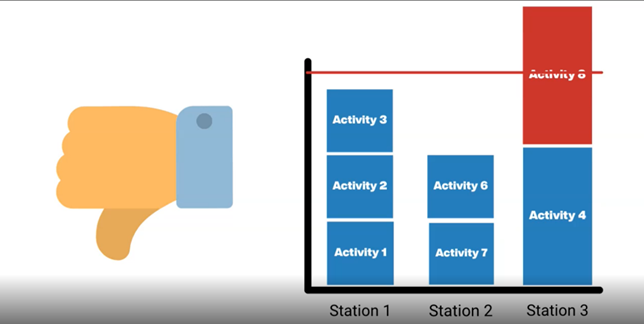
Unbalanced Line
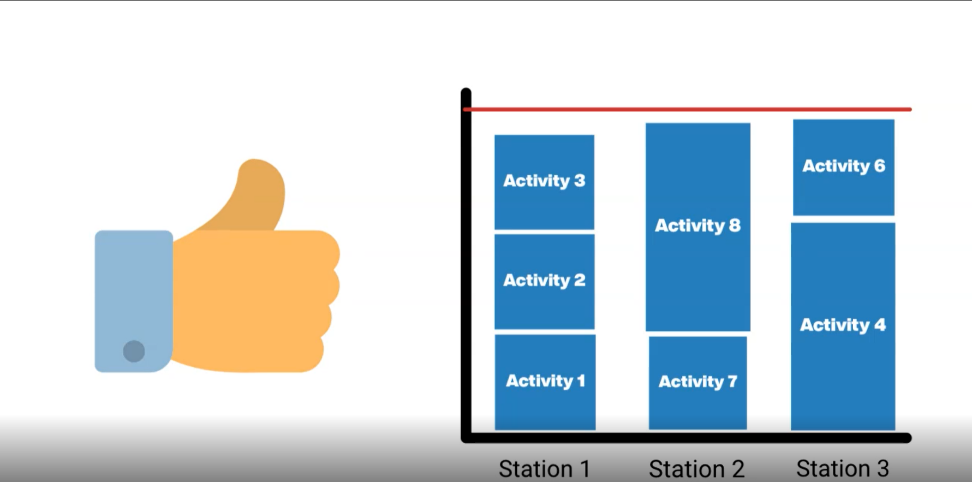
Balanced Line
Ideally, you also want to allocate the work evenly to each operator on the line and ensure that no operator has more work than the designed pace (TAKT) of the line. For example, if an assembly line needs to produce 16 products in an 8-hour work shift, then no operator should be assigned more than 30 minutes of work. This 30 minutes of work for the operator is called a Cycle Time and thus the longest cycle time of any operator determines the pace (TAKT) of the assembly line’s output.
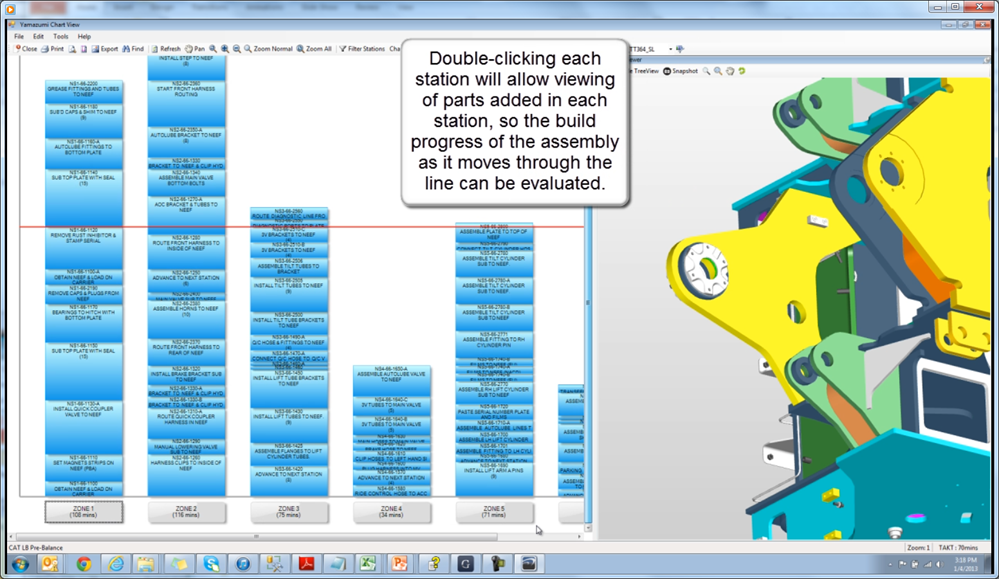
TAKT Time across Balanced Line
When evaluating the quality of an Assembly Line Balance it is common to compare the total product assembly time (i.e. summation of task times) with the combined available worker time per TAKT (i.e. TAKT time multiplied by the number of workers on the line). Ideally, you want to try and obtain percentages above 85%, but that will be difficult to do in a complex, mix-model production environment.
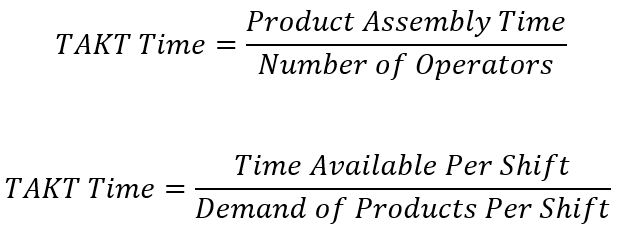
TAKT Time Formulas
Assembly line balancing is easy to do if your company only produces one product, but most companies produce a variety of products representing different models with different option configurations. For example, your assembly line may produce a coupe and then a truck and then a convertible and then another truck. Each of these products (aka customer orders) represents a different list of tasks for each operator to perform. Certainly, some of those tasks will be performed on all products by the same operator taking the same amount of time, while other tasks may only be performed on particular customer orders. This mixed-model production environment means that each operator has a range of possible cycle times depending on the specific product they are working on.
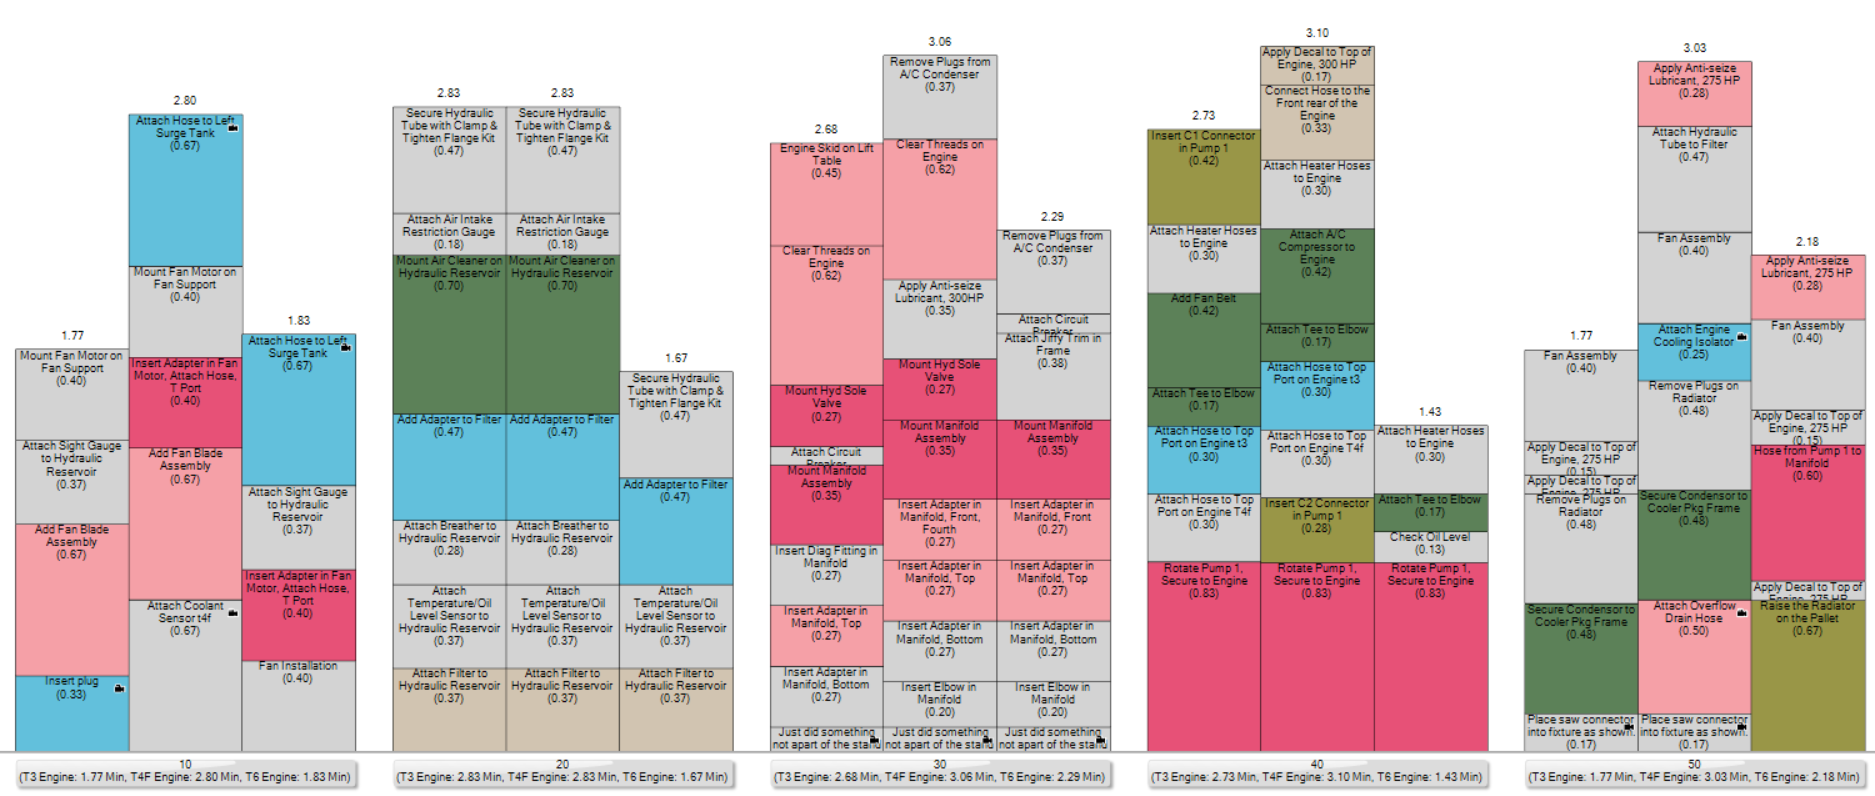
Yamazumi Chart
The yamazumi chart (above) shows the operator cycle times for three different products. The groupings of stacked bars represent workers on the line and the tiles in those bars represent Tasks assigned to them in the order they are to be performed. The height of each tile in the stacked bar represents the time that the task is expected to take. As such, from this chart, we can see that some operators have substantially different cycle times (summation of task times) depending on their product. As such, some companies choose to allocate tasks to workers such that their average Cycle time is below TAKT even if that means that occasionally they will encounter a product with a cycle time exceeding TAKT. This type of task allocation works well if operators are likely to only encounter their over-TAKT product between under-TAKT products, or if the over-TAKT product has a very low chance of occurrence.
The Drift Chart (below) is driven from line balancing studies in the Proplanner Scheduler module. In this chart, Operator cycle times are shown as rows for each successive product they work on throughout their shift. The green portion of the bar reflects the TAKT time of the line, so when the operator’s cycle time exceeds TAKT it is shown in red. Obviously, if an operator goes over TAKT on one work cycle, then it means they will start working late on the next cycle. With Drift charts, it is easy to see how successive long-cycle time jobs can make the worker farther and farther behind and create problems for the efficiency of the line. In the chart, you can see that the operator gets behind on the first work cycle and gets farther behind until around the 6th cycle, their product cycle times start to fall below TAKT and they can start to catch up. After about the 11th work cycle of the day, the operator actually is able to complete their cycle time under TAKT and they can rest up a bit (all but on the 14th work cycle).
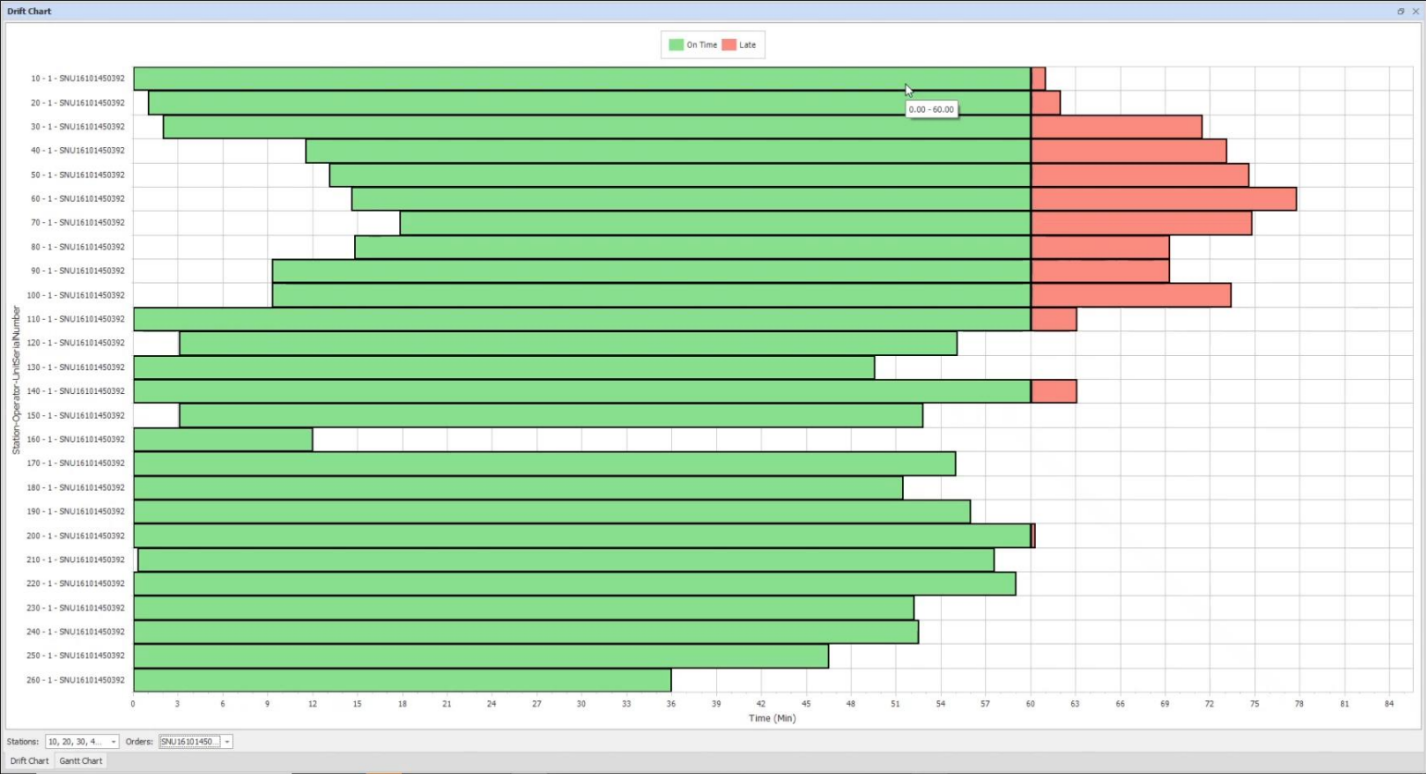
Drift Chart